
Why healthcare operations struggle even when everyone’s working hard — and what it takes to fix it.
A line from a 2026 hospital operations report stuck with me. Healthcare operations rarely struggle because leaders lack data. They struggle because the clinical, operational, financial, and workforce numbers all live in separate reports and separate meetings, with different definitions and different timelines.
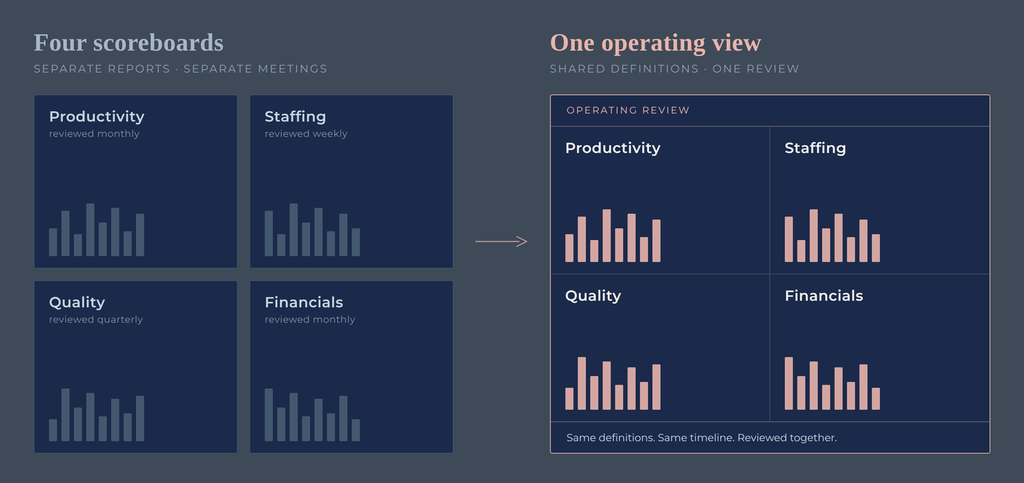
I’ve seen it play out again and again. Productivity gets reviewed in one meeting. Staffing in another. The financials somewhere else. Quality on its own track entirely. Every one of them looks fine in isolation, and yet overall performance still sits flat, because nobody is looking at them as one connected picture.
That disconnect is where margin quietly disappears. Not because people aren’t working hard, but because the operation is being run from four different scoreboards that never get laid side by side.
Why this happens
It’s rarely a failure of effort or intelligence. It’s structural. Each function builds the reporting that serves its own needs. Finance tracks the P&L. Operations tracks productivity and throughput. Clinical leadership tracks quality. HR tracks staffing and turnover. Each report is accurate. Each team is doing its job. But they’re built on different definitions, updated on different timelines, and reviewed in different rooms with different people.
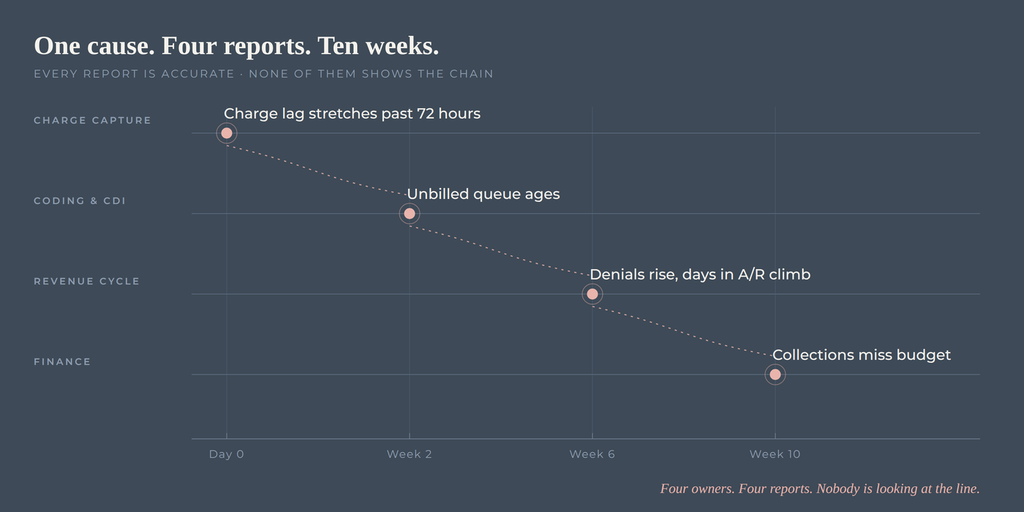
So when a problem lives in the space between those reports, and that’s where the expensive problems usually live, no single view catches it. Charge lag stretches past 72 hours. Two weeks later the unbilled queue is aging. By week six, denials are up and days in A/R are climbing. By week ten, Finance reports a collections miss, and the charge lag that caused it is two months old, sitting in a report nobody in that meeting owns.
What it actually costs
The cost isn’t just the missed margin. It’s the wasted motion. Leadership spends meetings reconciling numbers that don’t match, debating whose report is “right,” and reacting to problems after they’ve already compounded. Decisions get made on partial pictures. And the organization stays busy, everyone working hard, while system performance stays flat.
I’ve watched capable teams pour enormous energy into their individual scoreboards while the thing that actually needed attention sat in the gap between them, invisible.
The fix isn’t more data
The instinct, when performance lags, is often to build another report. More dashboards, more metrics, more detail. But more data rarely solves a problem that was never about a shortage of data.
The fix is one operating view — a connected picture that puts productivity, staffing, quality, and financial impact on the same page, with shared definitions and a shared timeline, so the team can come together to review and plan from one picture instead of four separate ones.
That means:
- Shared definitions. The same metric means the same thing across every function, so no one wastes time reconciling.
- A connected view. Productivity, staffing, quality, and financials sit side by side, so the relationships between them become visible.
- One planning rhythm. Leadership reviews and plans from that single view together, rather than each function defending its own scoreboard in isolation.
None of this requires a new system or a massive analytics investment. It requires the discipline to connect what you already track, and the willingness to plan from one picture instead of four.
The result
When an organization makes this shift, the change is quieter than people expect but more powerful than it sounds. Problems get caught earlier, because the connections are visible. Meetings get shorter and more decisive, because there’s no reconciling to do. And the energy that was going into maintaining four separate scoreboards goes into actually improving performance.
The operation stops being run from four different scoreboards, and starts being run from one.
If your organization is working hard but performance keeps sitting flat, the problem may not be in any single report — it may be in the space between them. That’s the kind of work I do: finding where performance is slipping and fixing the operations behind it.